


Even if you’re new to boating, it’s unlikely that you’re completely new to GPS systems. Maybe you have a car GPS to get you from point A to point B; maybe you rely on a smartphone; or maybe you’ve gotten very, very skilled at navigating Google Earth to creep on your favorite Zillow listings. (No judgment.) Regardless, we’re fairly positive you aren’t reading this article having only ever seen an old-fashioned paper map.
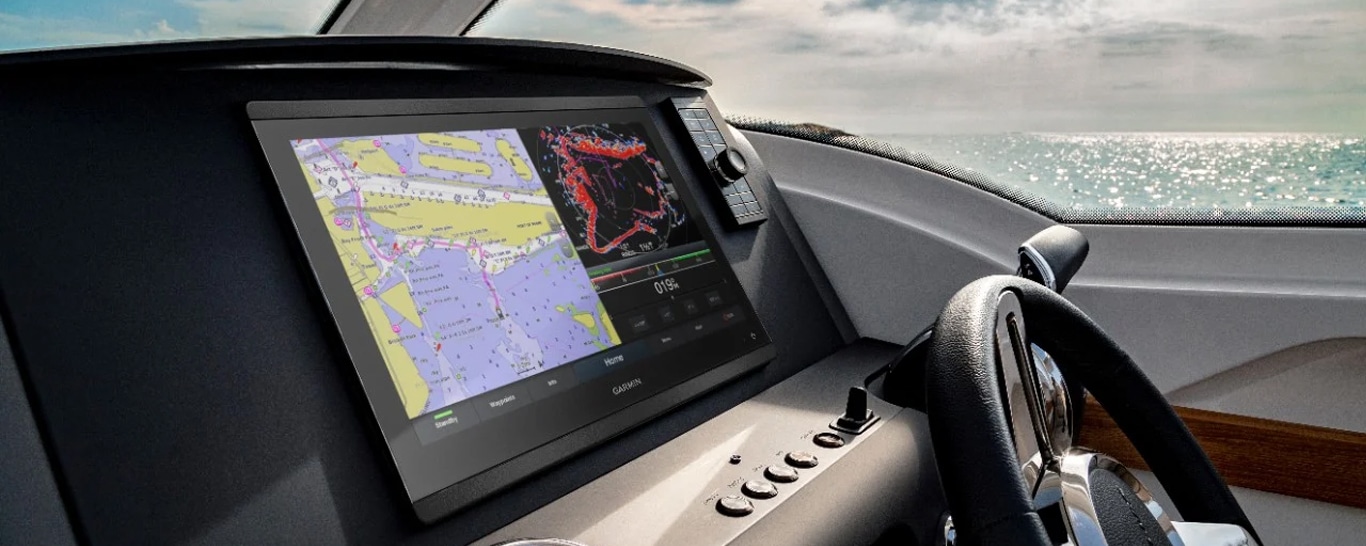
Unlike each of these examples, though, most modern, electronic marine charts have multiple layers, and the ones you’ll focus on the most depend on what type of activity or boating you’re going to do. Whether you want a standard navigation chart — just something simple to get you where you’re going — or something with super-detailed depth contours or relief shading to provide a clearer view of bottom structure for fishing purposes, have no fear. The Garmin and Navionics® family of cartography has it all. Depending on which chartplotter or mobile device you’re using, you’ll be able to flip back and forth between some or all of the following different layers to get the perfect view for the task at hand.
Chart Variations
Navigation Chart
An overhead view for navigating that includes data for buoys, lights, cables, depth soundings, marinas, tide stations and more.
Fishing Chart
An enhanced, detailed view of bottom contours, depth soundings and detailed bathymetric data that is perfect for identifying fishing structures like humps, holes and ledges, whether you’re fishing in salt water or fresh. On Navionics products, this is referred to as the SonarChart™ HD bathymetry map.
Relief Shading Chart Overlay
A high-resolution elevation shading of lakes and coastal waters that combines color and shadow for an easy-to-interpret, clearer view of bottom structure than contour lines alone can provide. This view can make it easy to spot channels, flats and even sunken ships that make up artificial reefs.
Satellite Imagery Chart Overlay
High-resolution satellite imagery overlay paired with a navigational chart to give you a realistic view of your surroundings for improved situational awareness.
Sonar Imagery
A view that reveals bottom hardness in vivid color to highlight both subtle and dramatic transition areas. Hard bottoms might include rocks or gravel or submerged road or creek beds, while soft bottoms might include sand or mud.
3D View
A 3-D representation of the surrounding area from either above or below the waterline. Different 3-D views include MarinerEye and FishEye.
ActiveCaptain® Community
The ActiveCaptain Community layer crowdsources datapoints from a community of boaters to include points of interest that users have uploaded, including information like ratings and reviews of marinas, fuel prices, local condition changes, new hazards and more. The latest update also includes photos.
So many choices, right? Don’t let it overwhelm you. Shaun Ruge, Garmin director of marine business development and licensed charter captain, has advice for anyone making their debut as a boater.
“New boaters need to know they don’t have to overthink it,” he says. “People get really intimidated by getting into boating. Boats aren’t as easy as cars, and there aren’t as clearly defined paths of navigation, right? It’s not a road, and there aren’t perfectly outlined lanes, but there is a system.” And you don’t necessarily have to use a compass — this is where Garmin and Navionics take out a lot of the intimidation and guesswork. “You can play with colors to make the map look as simple as you’d like it to look. It can be as easy as staying in one color and out of the other.”